J-Spring 2024: Mastering Java Performance: From Monitoring to Profiling – Lennart ten Wolde
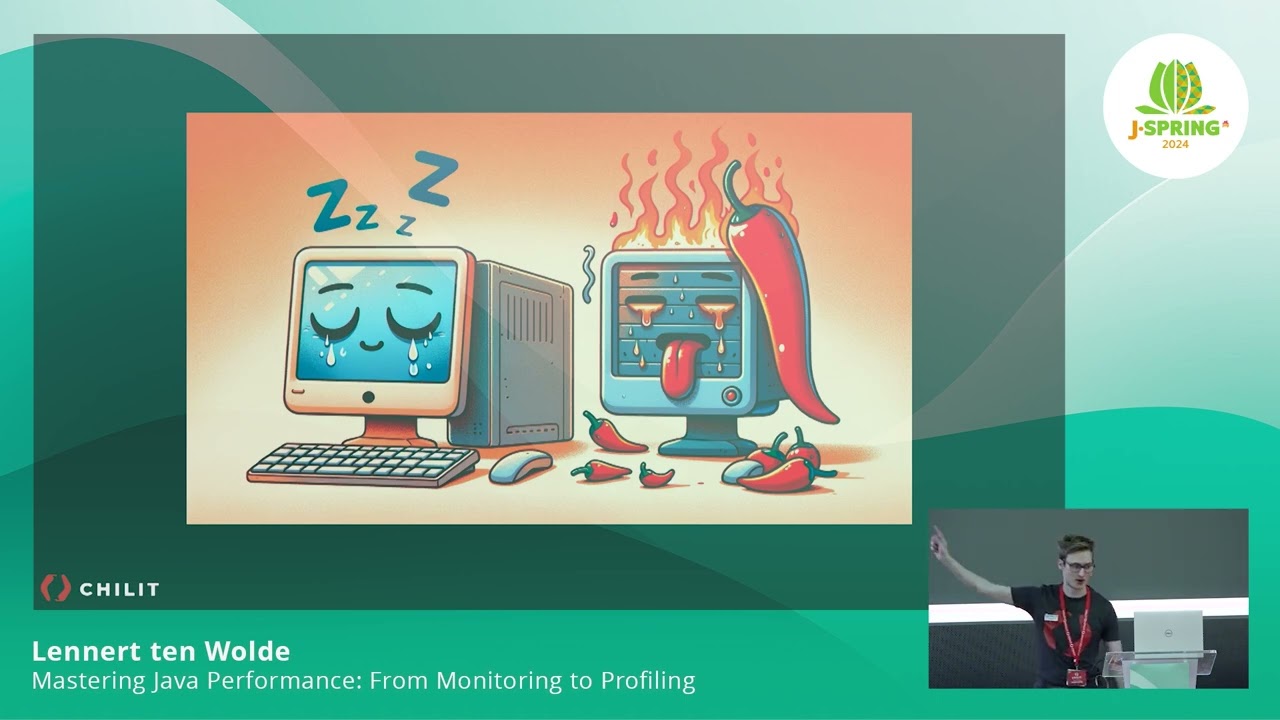
This session builds on the principles discussed in the keynote and delves deeper into the hierarchy of performance bottlenecks in Java applications. We will address more complex examples of performance degradation in various systems such as frameworks, databases, and concurrency management. The focus is on the use of diagnostic tools and profiling techniques. These tools can assist you in quickly and effectively detecting and resolving performance issues. Additionally, we will discuss practical examples that illustrate how performance issues manifest (typically only in production), such as exhausted connection pools due to API calls within a transaction and full table scans caused by inadequate indexing. We conclude the session with a clear action plan for setting up effective monitoring and making potential bottlenecks visible. After this presentation, you will have more tools under your belt to anticipate and quickly resolve performance issues, allowing you to focus your efforts in the right area.


