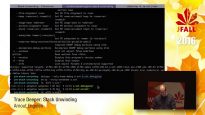
The JVM provides amazing tools to find out what’s going on inside it, allowing you to profile and trace your application, set breakpoint and debug. In the end the JVM itself is also just another program running on your machine. As such you can inspect it with low-level tools such as the GNU Project Debugger. Until recently this would only give you insight in JVM internals, not in your application. Recently some amazing work has been done to bring these worlds together: this talk will demonstrate a a ‘stack unwinder’ gdb plugin, while will allow you to see traces all the way from deep JVM internals to your actual application code.
Bio van Arnout Engelen
With over a decade of experience in professional software development, Arnout is constantly on the lookout for tools to smoothen and simplify that process. He currently consults for Xebia, helping developers in larger corporations in the Netherlands write code with confidence.